About the Published Microplastics Study Map
This interactive map is derived from the supplemental dataset accompanying the systematic review by Nyadjro et al. The map is intended as an educational and reference visualization of published microplastics study locations, not as a current global contamination map.
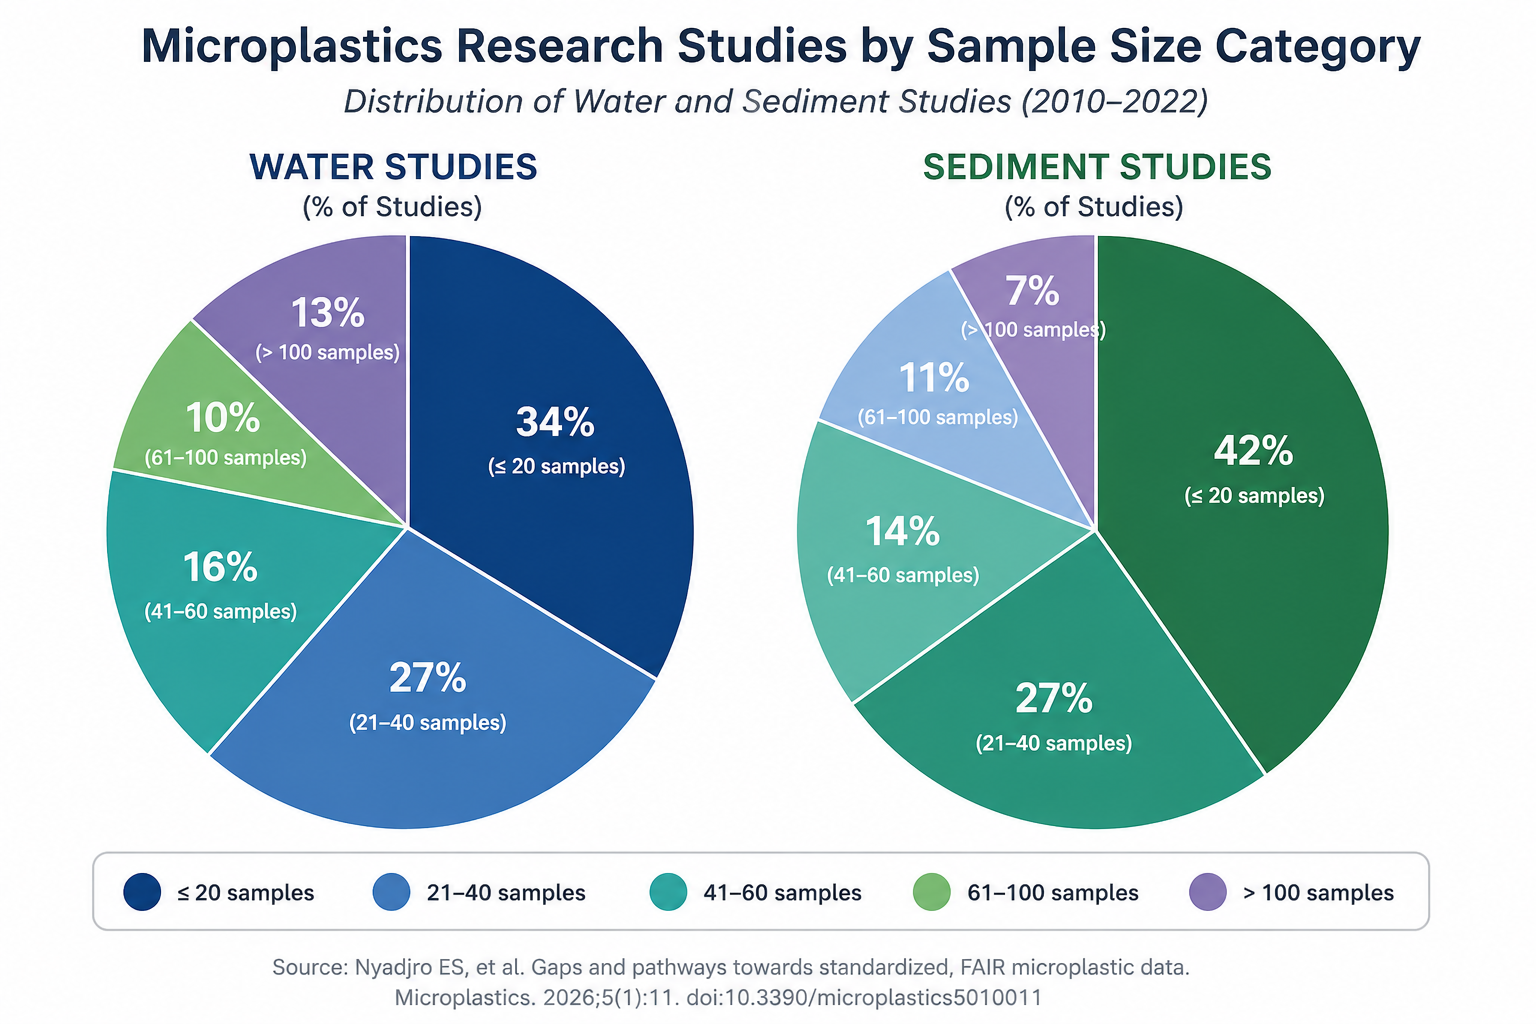
Nyadjro ES, et al. Gaps and Pathways Towards Standardized, FAIR Microplastic Data Harmonization: A Systematic Review. Microplastics. 2026;5(1):11. DOI: 10.3390/microplastics5010011
Key Findings from the Review
- Approximately 61% of water studies analyzed fewer than 40 samples.
- Approximately 34% of water studies analyzed 20 samples or fewer.
- Most studies were based on single-time sampling, limiting long-term analyses.
- Sampling methods, analytical approaches, and reporting metrics varied substantially between studies.
- Multiple reporting frameworks were used, including particle counts, concentration-based metrics, and mass-based measurements.
- Large geographic and temporal monitoring gaps remain.
Why This Matters
Published microplastics studies have generated valuable scientific knowledge; however, many studies represent individual sampling campaigns conducted at a single location and timepoint. Longitudinal monitoring datasets remain relatively limited, and substantial variation exists in sampling methods, analytical approaches, reporting units, and metadata collection.
The challenge facing the field is increasingly one of environmental monitoring and data harmonization rather than detection alone. Future monitoring efforts may benefit from standardized metadata collection, repeat measurements, broader geographic coverage, and scalable approaches capable of supporting larger numbers of observations over time.
Policy and Monitoring Perspective
For additional discussion of monitoring scalability, longitudinal surveillance, policy implications, and characteristics that may be required for future microplastic and nanoplastic monitoring systems, see:
Chu MB.
From Policy Prioritization Goals to Scalable Monitoring: Characteristics Needed for Effective Microplastic and Nanoplastic Detection Systems.
Zenodo. 2026.
https://doi.org/10.5281/zenodo.20586503
Educational and reference use only. Study locations are approximate where exact coordinates were unavailable. Studies vary in sampling year, analytical methods, size cutoffs, matrices, and reporting units; therefore, the points should not be interpreted as a current global contamination map or as directly comparable concentration measurements.